With the government currently mulling over various changes to student finance I thought it would be a worthwhile exercise to map out how student loan repayments work in context. Repayments currently operate like a tax – graduates have 9% of everything they earn above their repayment threshold taken from their paycheck. Graduates’ repayment thresholds are determined by whether they began their studies pre-2012 (the ‘Plan 1’ regime) or post-2012 (the ‘Plan 2 regime’), whilst the thresholds themselves are raised to account for inflation annually for Plan 1 and when the government feels like it for Plan 2.
This makes it sensible to view student loan repayments alongside the other key taxes, i.e. national insurance and income tax, as you’d expect workers to be more concerned with their final takehome pay than what balance sheets their tax has been split between.
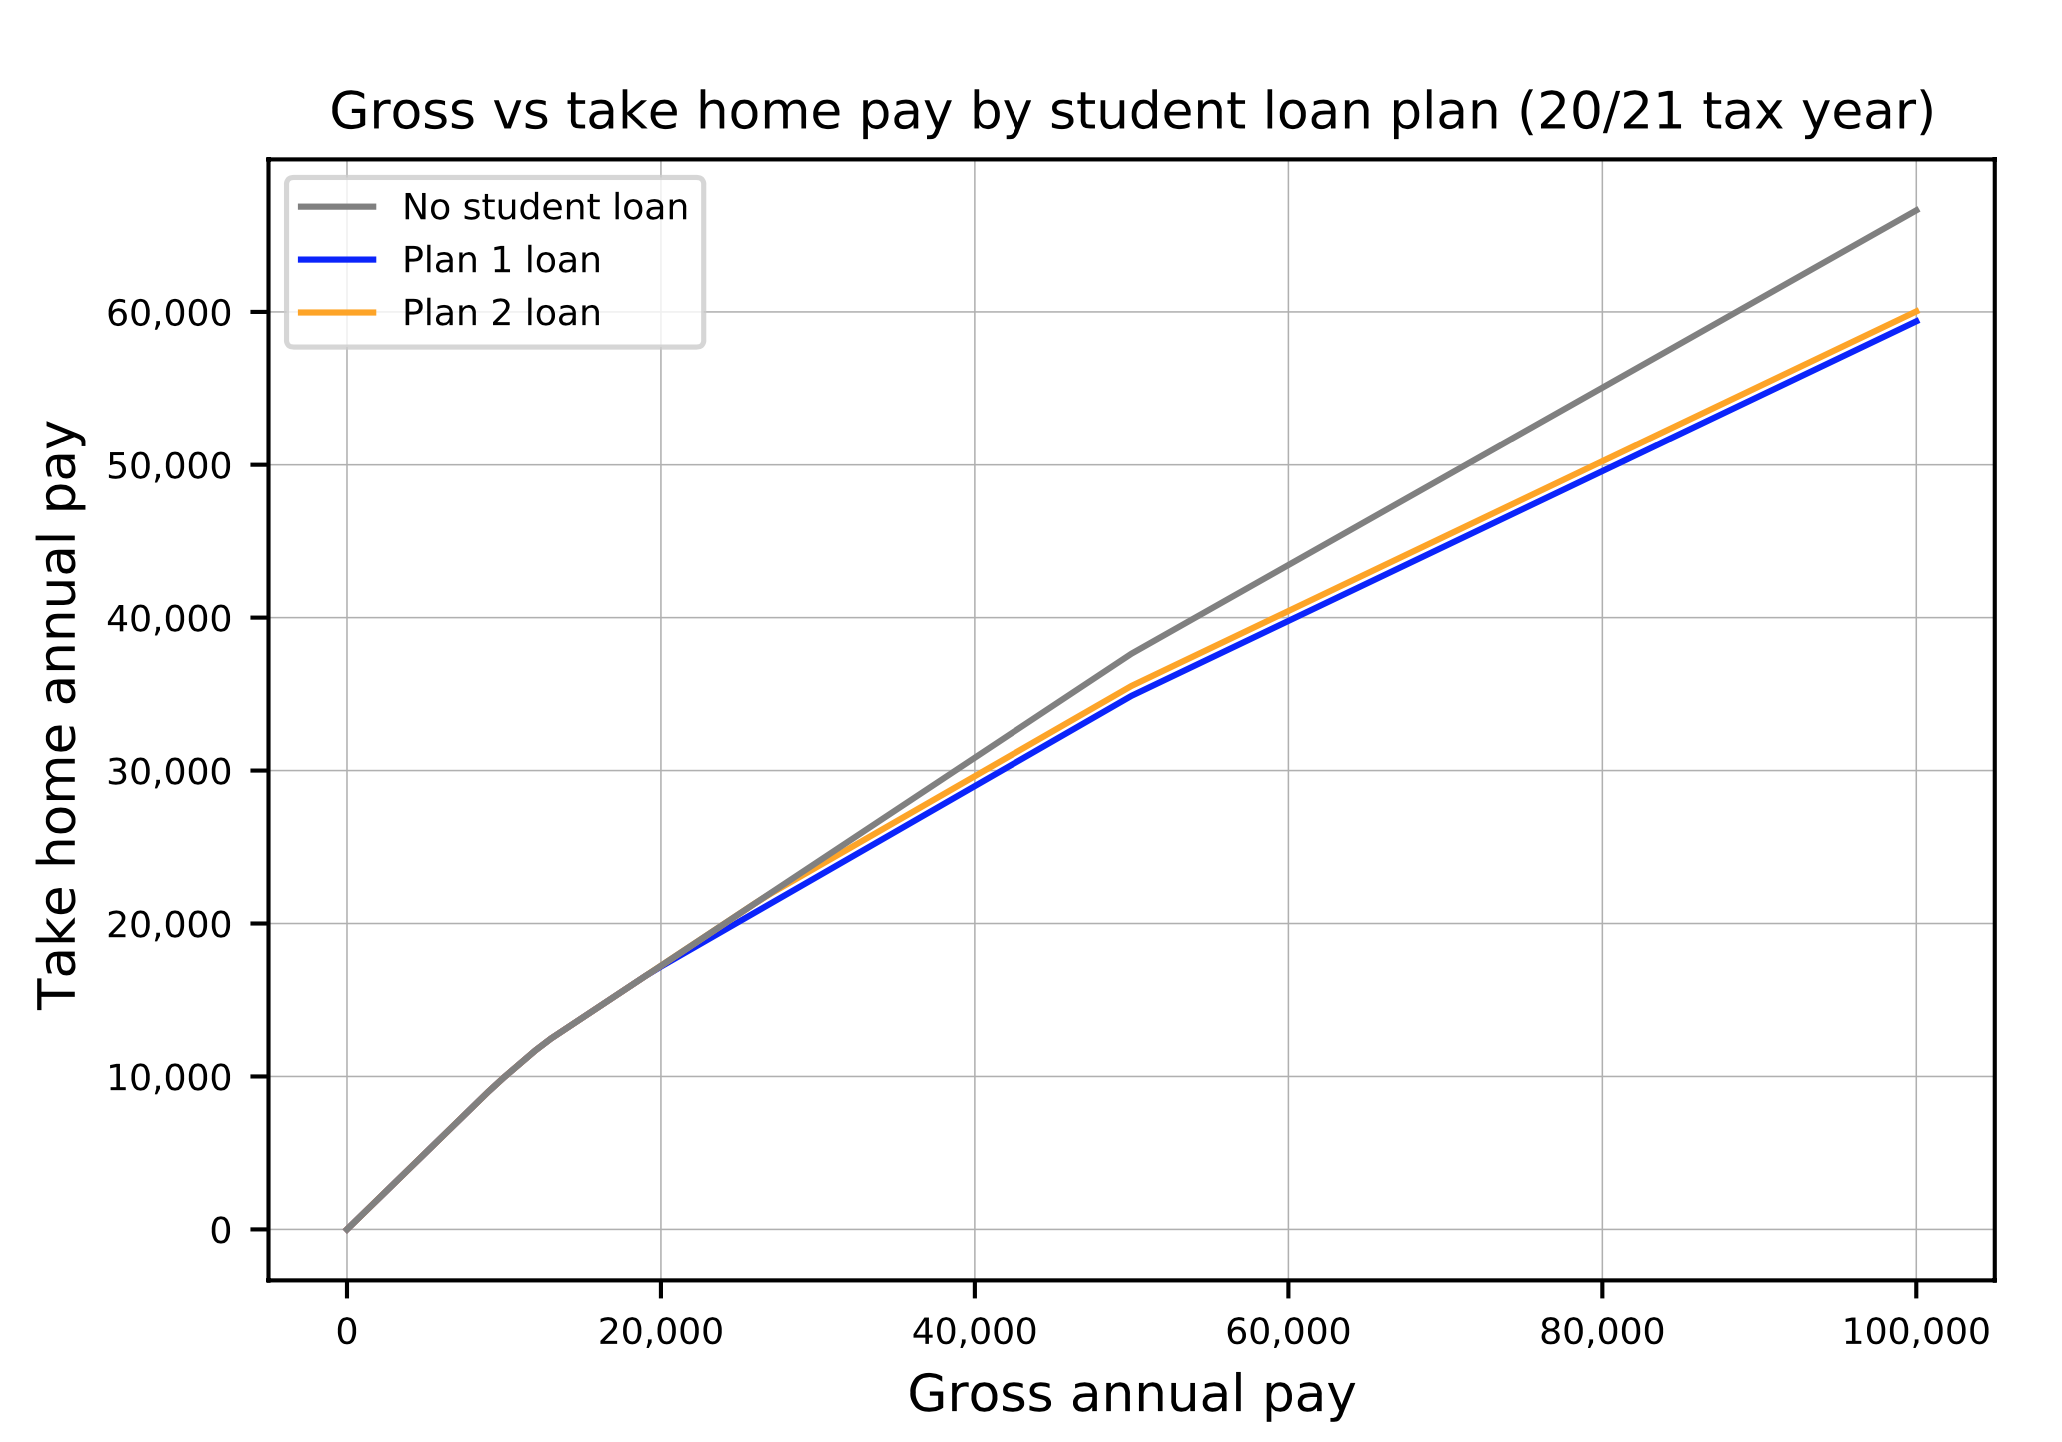
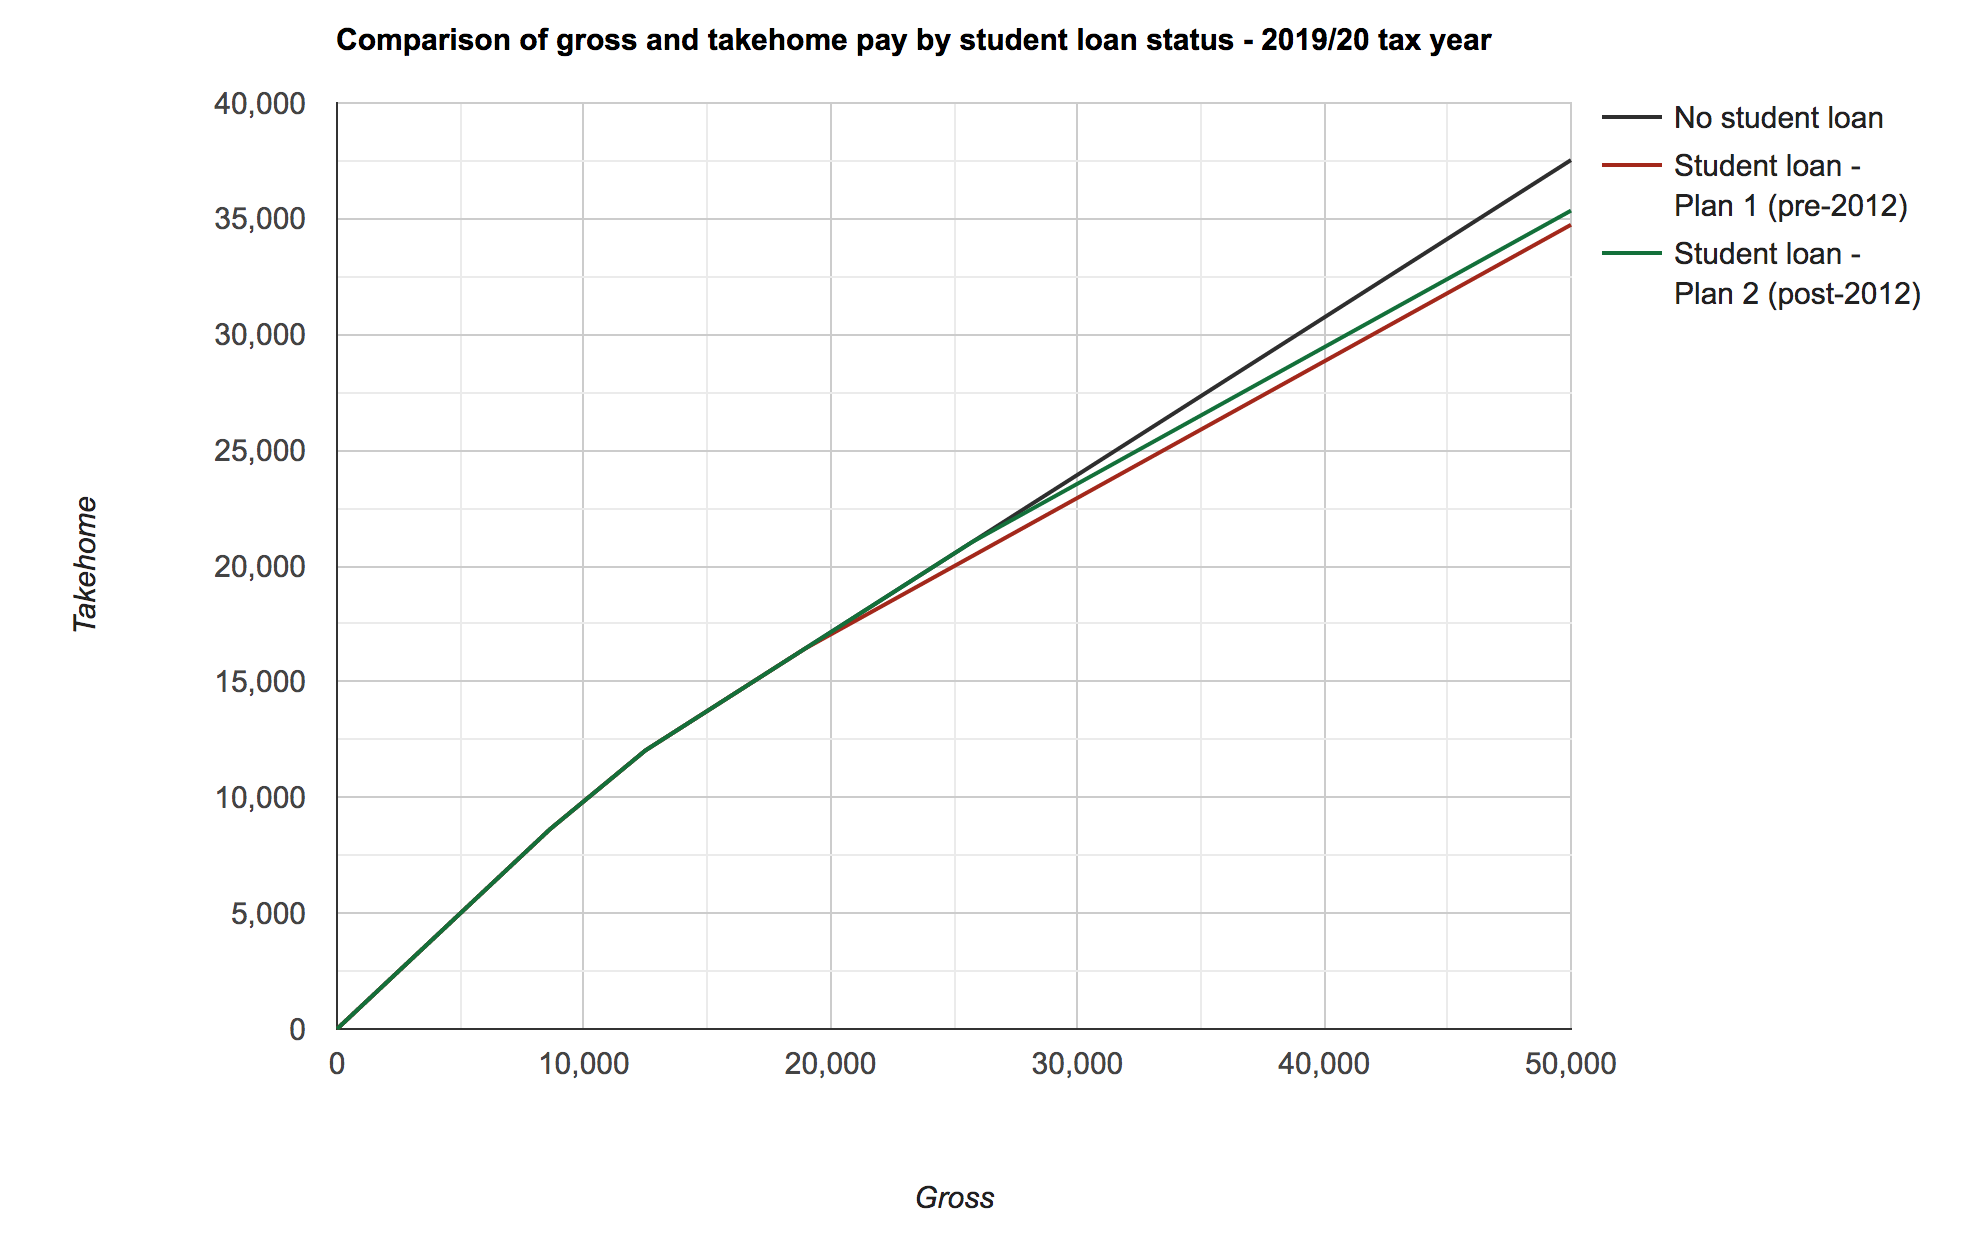
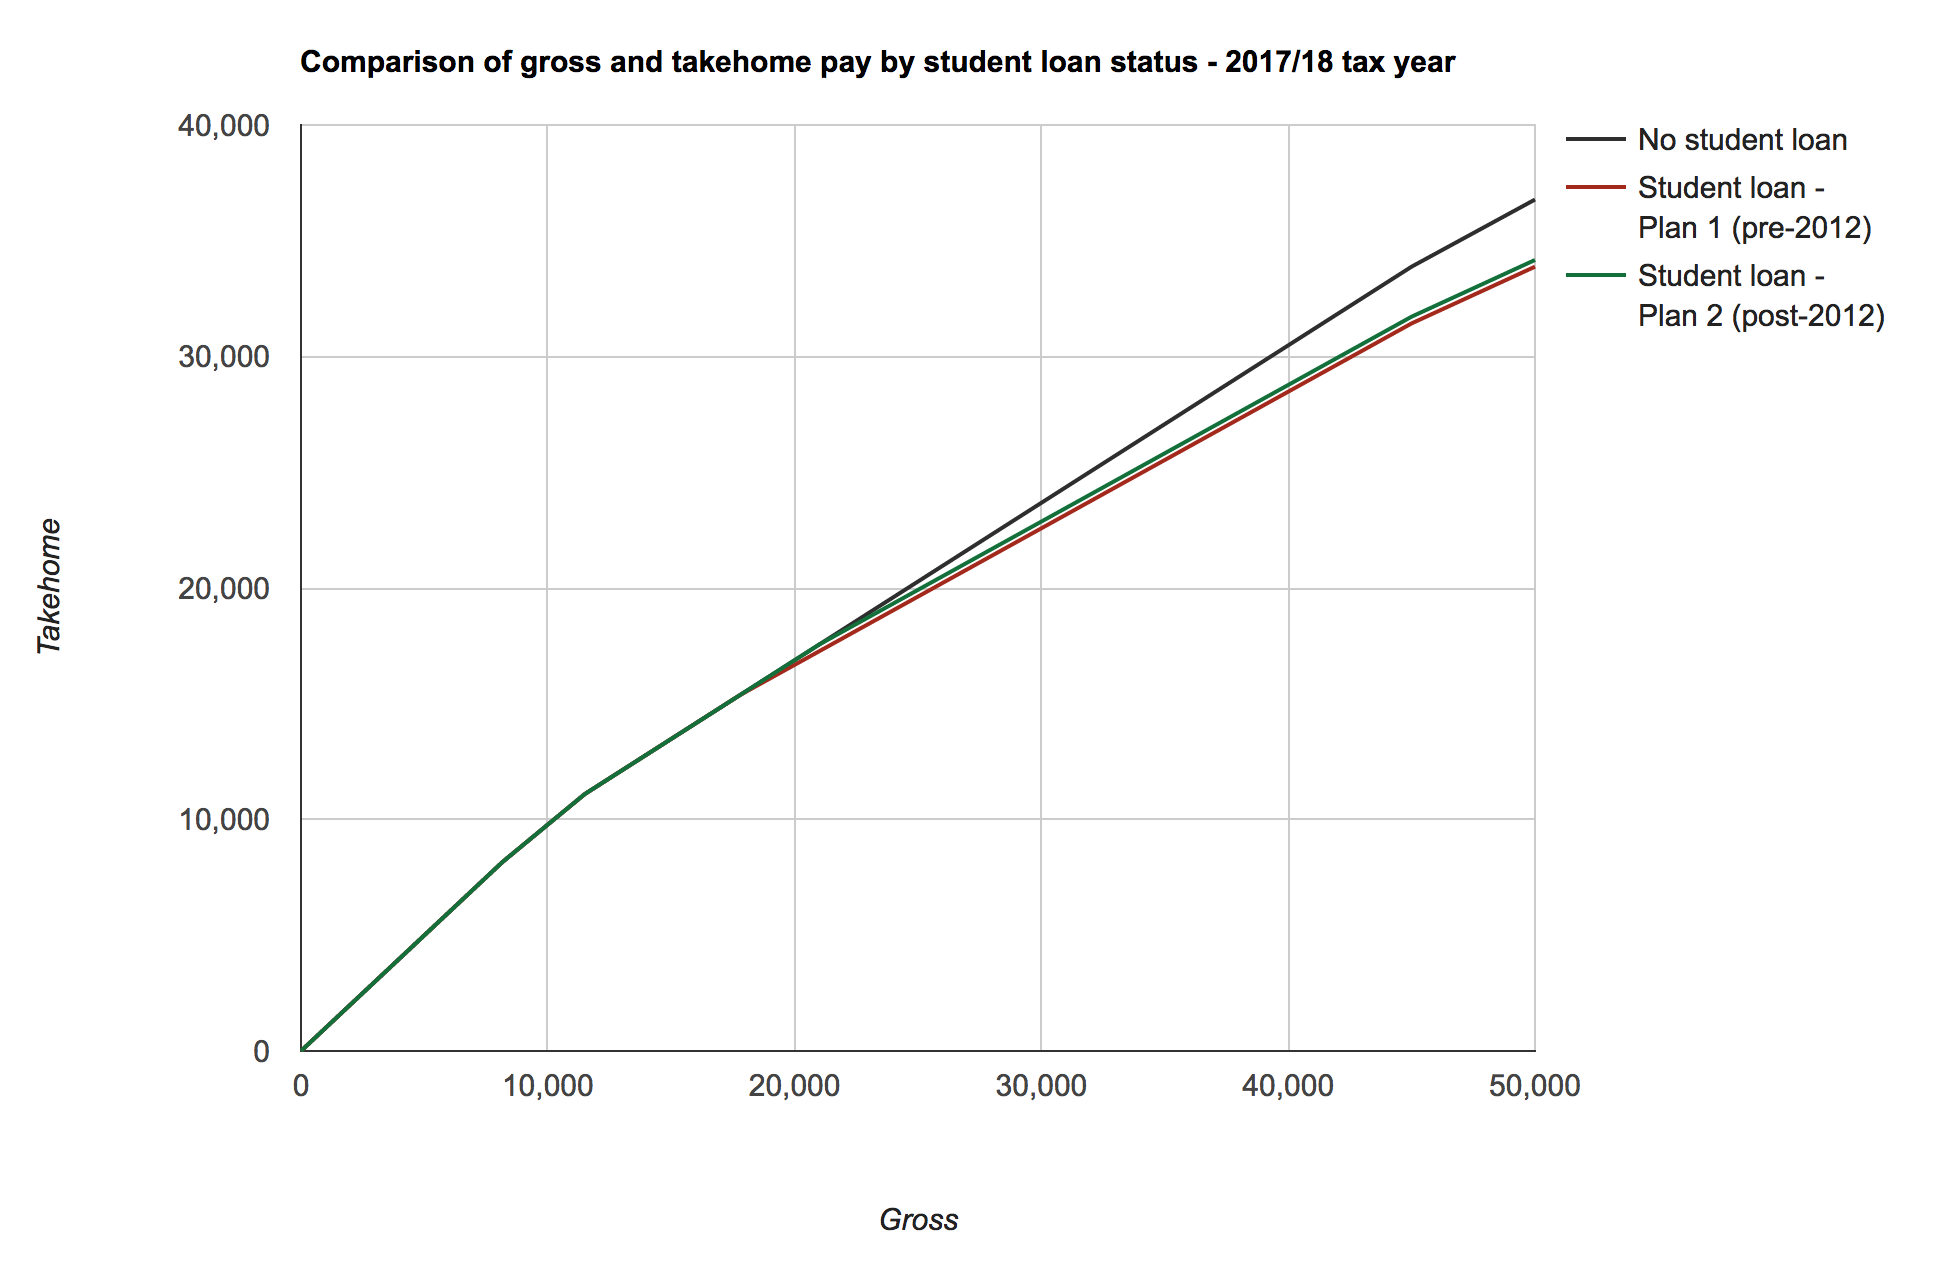
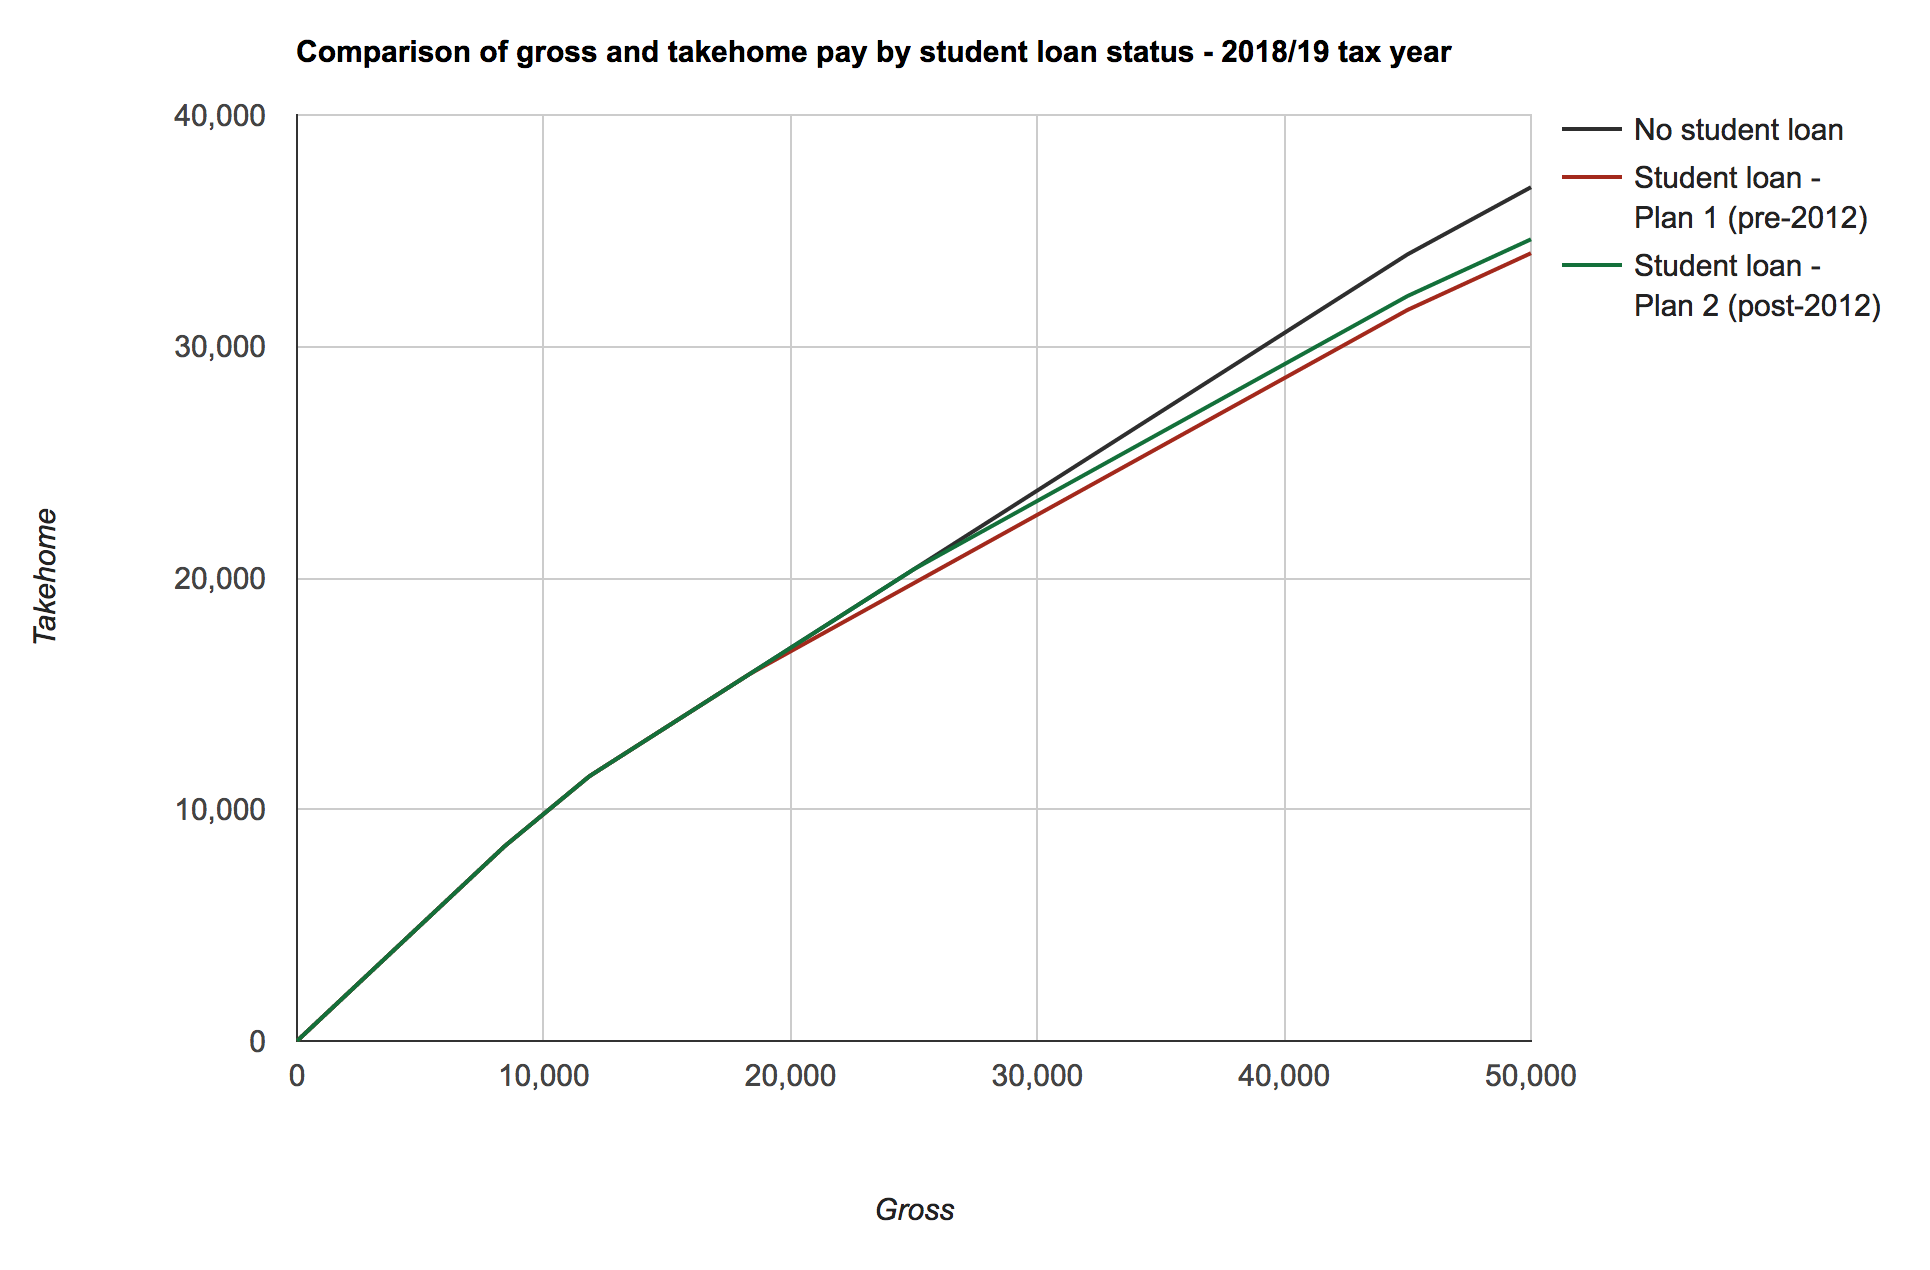
With that in mind I’ve put together a graph showing the different relationships between gross and takehome pay for workers depending on whether they have an outstanding student loan and if so under what regime.
Click here to see the full-size (interactive-ish) graph.
The repayment thresholds for both Plan 1 and Plan 2 are changing this coming April:
|
2017/18 |
2018/19 |
| Plan 1 |
£17,775 |
£18,330 |
| Plan 2 |
£21,000 |
£25,000 |
The income tax and national insurance thresholds will also be changing in the new tax year, so with these all put together we can see how the graph will look in April.
Click here to see the full-size (interactive-ish) graph.
Note: The maths for these graphs is done in PHP and I originally wrote the code that they use to form part of some money/budgeting tools I was building for myself. Being slightly obsessed with personal financial planning I wanted to know exactly how my takehome pay would change in the new tax year and thought others might too.
Further note: All of this ignores pension contributions. I don’t do pensions.